
Retention analytics use your data to identify accounts approaching renewal that are statistically similar to past customer cancellations. Expressed another way: “Past behavior is an indicator of future actions.” By using your own data to generate these insights, you can be assured that the information is accurate and actionable.
Insights are segmented into three categories:
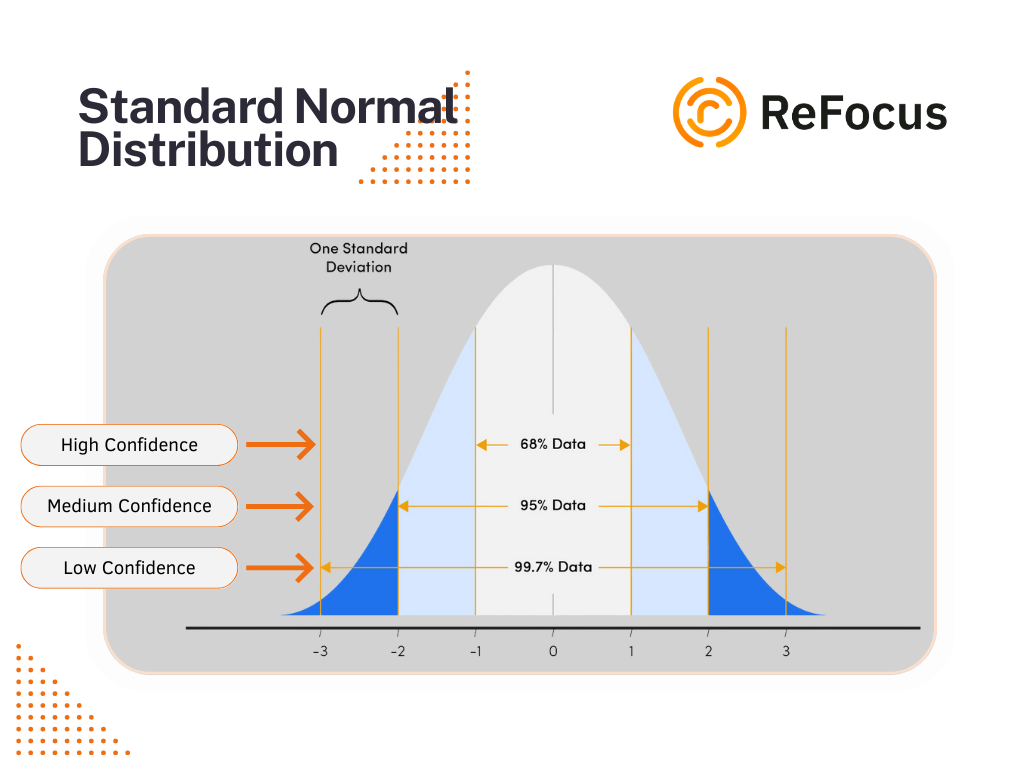
- High Confidence: These predictions are the top 50% of the bell curve compared to other predictions.
- Medium Confidence: These predictions are the next 25% of the bell curve compared to other predictions.
- Low confidence: These predictions are the last 25% of the bell curve compared to other predictions.
These three tiers are called qualitative confidence and help your organization right-size the engagement with each tier.
Why isn’t everything High Confidence?
A question we frequently receive is why predictions vary in confidence. The accuracy of a machine learning model can be influenced by the amount and quality of the data used for training, the suitability of the model design, and the uncertainty and variability of the input data. Predictions with high confidence suggest that the model is confident about its output, while low-confidence predictions indicate that the model has less data to draw from.
Read the next article in the Best Practices Guide, Using Retention Analytics.